Power Query is a powerful data transformation tool in Power BI that allows users to easily clean, shape, and integrate data from several sources. In this tutorial, we will look at some examples of Power Query.
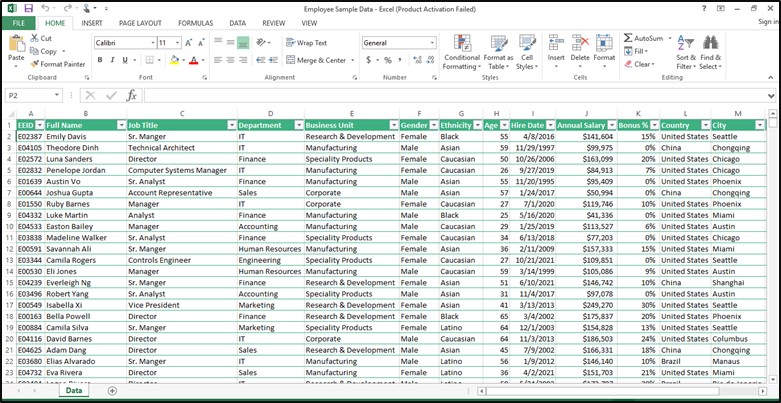
Step#01 Below is the Excel file containing sample employee data that we will import into Power BI. You can download this file from https://www.thespreadsheetguru.com/sample-data/

Figure 1: Sample data of employees
Step#02 Importing data in Power BI using “Excel Workbook” Connectors.

Figure 2: Importing Employee’s data in Power BI
Step#03 I have successfully imported the data in Power BI.

Figure 3: Data is successfully imported into Power BI
Step #04 You have seen a Power Queries (code) behind this data import. This is generated automatically during the import process. In the below examples, we will look at how we modify this query to do different activities.

Figure 4: Auto-generated Power Query
Step #05 Suppose I want to change this query to include an additional step of creating a column with all 0 values. To do this, the following query can be executed.
let
    Source = Excel.Workbook(File.Contents("C:\Users\my data\Downloads\EmployeeSampleData\Employee Sample Data.xlsx"), null, true),
    Data_Sheet = Source{[Item="Data",Kind="Sheet"]}[Data],
    #"Promoted Headers" = Table.PromoteHeaders(Data_Sheet, [PromoteAllScalars=true]),
    #"Changed Type" = Table.TransformColumnTypes(#"Promoted Headers",{{"EEID", type text}, {"Full Name", type text}, {"Job Title", type text}, {"Department", type text}, {"Business Unit", type text}, {"Gender", type text}, {"Ethnicity", type text}, {"Age", Int64.Type}, {"Hire Date", type date}, {"Annual Salary", Int64.Type}, {"Bonus %", type number}, {"Country", type text}, {"City", type text}, {"Exit Date", type date}}),
    #"Added Custom" = Table.AddColumn(#"Changed Type", "New Column", each 0)
in
    #"Added Custom"
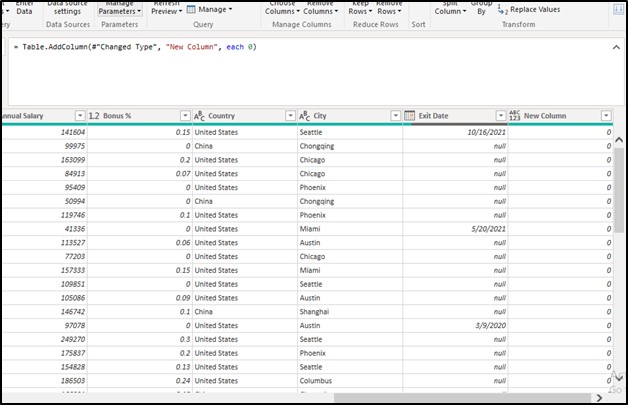
Step #06 After executing this query, a column is added successfully as shown below:

Figure 5: Result of the above query
Step #07 Now, suppose I want to replace the “United States” value in the “Country” column with “India”. Then the following query can be executed.
let
    Source = Excel.Workbook(File.Contents("C:\Users\mydata\Downloads\EmployeeSampleData\Employee Sample Data.xlsx"), null, true),Data_Sheet = Source{[Item="Data",Kind="Sheet"]}[Data],
    #"Promoted Headers" = Table.PromoteHeaders(Data_Sheet, [PromoteAllScalars=true]),
    #"Changed Type" = Table.TransformColumnTypes(#"Promoted Headers",{{"EEID", type text}, {"Full Name", type text}, {"Job Title", type text}, {"Department", type text}, {"Business Unit", type text}, {"Gender", type text}, {"Ethnicity", type text}, {"Age", Int64.Type}, {"Hire Date", type date}, {"Annual Salary", Int64.Type}, {"Bonus %", type number}, {"Country", type text}, {"City", type text}, {"Exit Date", type date}}),
    #"Added Custom" = Table.AddColumn(#"Changed Type", "New Column", each 0),
    #"Replaced Value" = Table.ReplaceValue(#"Added Custom","United States","India",Replacer.ReplaceText,{"Country"})
in
    #"Replaced Value"
Step #08 After executing this query, values are replaced.

Figure 6: Result of the above Power Query
Step #09 Suppose I would like to determine each employee’s overall salary by multiplying the “Annual Salary” by the “Bonus%” and putting the result in a new column. Here is the changed Power Query including this extra step.
let
    Source = Excel.Workbook(File.Contents("C:\Users\mydata\Downloads\EmployeeSampleData\Employee Sample Data.xlsx"), null, true),
    Data_Sheet = Source{[Item="Data",Kind="Sheet"]}[Data],
    #"Promoted Headers" = Table.PromoteHeaders(Data_Sheet, [PromoteAllScalars=true]),
    #"Changed Type" = Table.TransformColumnTypes(#"Promoted Headers",{{"EEID", type text}, {"Full Name", type text}, {"Job Title", type text}, {"Department", type text}, {"Business Unit", type text}, {"Gender", type text}, {"Ethnicity", type text}, {"Age", Int64.Type}, {"Hire Date", type date}, {"Annual Salary", Int64.Type}, {"Bonus %", type number}, {"Country", type text}, {"City", type text}, {"Exit Date", type date}}),
    #"Added Custom" = Table.AddColumn(#"Changed Type", "New Column", each 0),
    #"Replaced Value" = Table.ReplaceValue(#"Added Custom","United States","India",Replacer.ReplaceText,{"Country"}),
    #"Added Custom1" = Table.AddColumn(#"Replaced Value", "Total Salary", each [Annual Salary] * [#"Bonus %"], type number)
in
    #"Added Custom1"
Step #10 After executing this query, “Total salary” is calculated.

Figure 7: Result of the above Power Query
Step #11 Suppose I want to determine the total length of every employee’s complete name and put the result of this operation into a new column.
let
    Source = Excel.Workbook(File.Contents("C:\Users\mydata\Downloads\EmployeeSampleData\Employee Sample Data.xlsx"), null, true),
    Data_Sheet = Source{[Item="Data",Kind="Sheet"]}[Data],
    #"Promoted Headers" = Table.PromoteHeaders(Data_Sheet, [PromoteAllScalars=true]),
    #"Changed Type" = Table.TransformColumnTypes(#"Promoted Headers",{{"EEID", type text}, {"Full Name", type text}, {"Job Title", type text}, {"Department", type text}, {"Business Unit", type text}, {"Gender", type text}, {"Ethnicity", type text}, {"Age", Int64.Type}, {"Hire Date", type date}, {"Annual Salary", Int64.Type}, {"Bonus %", type number}, {"Country", type text}, {"City", type text}, {"Exit Date", type date}}),
    #"Added Custom" = Table.AddColumn(#"Changed Type", "New Column", each 0),
    #"Replaced Value" = Table.ReplaceValue(#"Added Custom","United States","India",Replacer.ReplaceText,{"Country"}),
    #"Added Custom2" = Table.AddColumn(#"Added Custom1", "Full Name Length", each Text.Length([Full Name]))
in
    #"Added Custom2"
Step #12 Following is a result after executing the above query.

Figure 8: Result of the above Power Query
Step #13 Suppose I want to determine the age group of every employee according to their age. We will divide employees into three categories of age: “Young,” “Middle-aged,” and “Senior.” Here’s an updated Power Query that includes the extra step:
let
    Source = Excel.Workbook(File.Contents("C:\Users\mydata\Downloads\EmployeeSampleData\Employee Sample Data.xlsx"), null, true),
    Data_Sheet = Source{[Item="Data",Kind="Sheet"]}[Data],
    #"Promoted Headers" = Table.PromoteHeaders(Data_Sheet, [PromoteAllScalars=true]),
    #"Changed Type" = Table.TransformColumnTypes(#"Promoted Headers",{{"EEID", type text}, {"Full Name", type text}, {"Job Title", type text}, {"Department", type text}, {"Business Unit", type text}, {"Gender", type text}, {"Ethnicity", type text}, {"Age", Int64.Type}, {"Hire Date", type date}, {"Annual Salary", Int64.Type}, {"Bonus %", type number}, {"Country", type text}, {"City", type text}, {"Exit Date", type date}}),
    #"Added Custom" = Table.AddColumn(#"Changed Type", "New Column", each 0),
    #"Replaced Value" = Table.ReplaceValue(#"Added Custom","United States","India",Replacer.ReplaceText,{"Country"}),
    #"Added Custom1" = Table.AddColumn(#"Replaced Value", "Total Salary", each [Annual Salary] * [#"Bonus %"], type number),
    #"Added Custom2" = Table.AddColumn(#"Added Custom1", "Age Group", each
        if [Age] <= 30 then "Young"
        else if [Age] <= 50 then "Middle-aged"
        else "Senior"
    )

in
    #"Added Custom2"
Step #14 Following is a result after executing the above query.

Figure 9: Result of the above Power Query
Step #15 Suppose I would like to determine each employee’s entire period of service by subtracting their “Hire Date” from today’s date and putting the result in a new column. Here’s an updated Power Query with this extra step:
let
    Source = Excel.Workbook(File.Contents("C:\Users\mydata\Downloads\EmployeeSampleData\Employee Sample Data.xlsx"), null, true),
    Data_Sheet = Source{[Item="Data",Kind="Sheet"]}[Data],
    #"Promoted Headers" = Table.PromoteHeaders(Data_Sheet, [PromoteAllScalars=true]),
    #"Changed Type" = Table.TransformColumnTypes(#"Promoted Headers",{{"EEID", type text}, {"Full Name", type text}, {"Job Title", type text}, {"Department", type text}, {"Business Unit", type text}, {"Gender", type text}, {"Ethnicity", type text}, {"Age", Int64.Type}, {"Hire Date", type date}, {"Annual Salary", Int64.Type}, {"Bonus %", type number}, {"Country", type text}, {"City", type text}, {"Exit Date", type date}}),
    #"Added Custom" = Table.AddColumn(#"Changed Type", "New Column", each 0),
    #"Replaced Value" = Table.ReplaceValue(#"Added Custom","United States","India",Replacer.ReplaceText,{"Country"}),
    #"Added Custom1" = Table.AddColumn(#"Replaced Value", "Total Salary", each [Annual Salary] * [#"Bonus %"], type number),
    #"Added Custom2" = Table.AddColumn(#"Added Custom1", "Age Group", each
        if [Age] <= 30 then "Young"
        else if [Age] <= 50 then "Middle-aged"
        else "Senior"
    ),
   #"Added Custom3" = Table.AddColumn(#"Added Custom2", "Years of Service", each Duration.Days(DateTime.LocalNow() - DateTime.From([Hire Date])) / 365)
in
    #"Added Custom3"
Step #16 Following is a result after executing the above query.

Figure 10: Result of above Power Query
That’s the end..!!! Continue to learn and stay interested! Share what you have learned and any questions you have in the comments section below. “Happy querying!”

